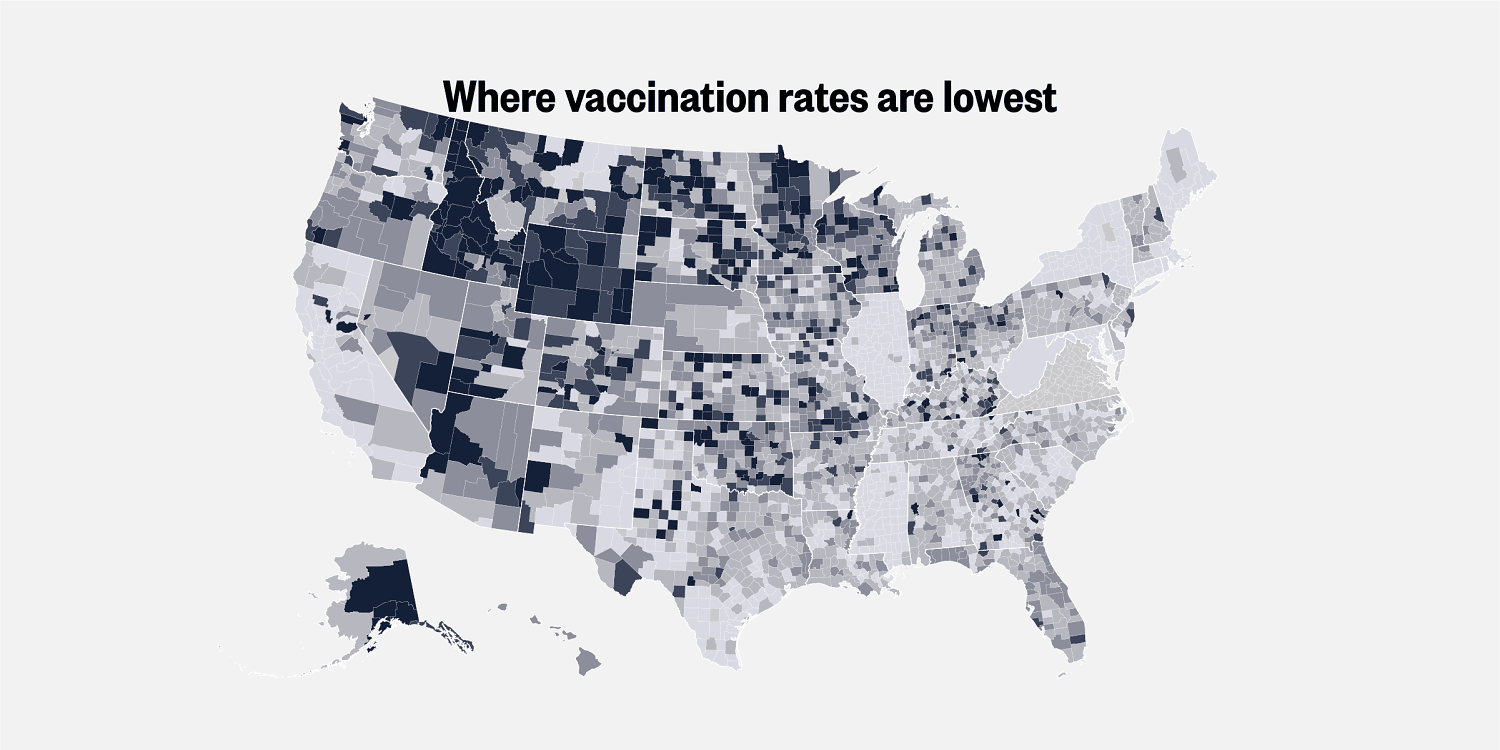
We used to take routine childhood immunizations for granted. Parents signed the school forms, kids got their shots, and preventable diseases stayed locked away in history textbooks. That's not the reality anymore. National immunization coverage has slid downward for consecutive years, leaving distinct pockets of vulnerability across the United States.
When major media outlets like NBC News teamed up with academic researchers to dig into school immunization data, they didn't just look at broad national averages. They scraped and analyzed state-by-state, county-by-county records to expose the real story behind the numbers. Here is how that tracking works, why the downward slide matters, and what the data actually reveals.
The Problem with National Averages
If you only look at top-level federal numbers, you might miss the crisis entirely. A national vaccination rate hovering around ninety percent sounds reassuring on paper. But public health data hides messy truths in the aggregate.
When investigative units and university researchers mapped local school district data, they found massive geographic clustering. Whole counties and individual private or charter schools showed exemption rates climbing into double digits.
Herd immunity isn't a national metric. It works on a hyper-local level—school by school, playground by playground. When vaccination coverage drops below specific thresholds in a single community, diseases like measles and pertussis find an open door. That's precisely why the U.S. has experienced surging measles outbreaks recently, threatening the nation's historical elimination status.
How Investigators Track the Decline
Tracking childhood immunization rates isn't as simple as pulling a single database from a federal portal. Public health reporting is decentralized, messy, and dependent on state laws.
To map the trends accurately, data journalists and epidemiologists had to compile records from state health departments and individual school districts. This process involves navigating wildly different state reporting standards. Some states publish detailed kindergarten exemption data down to the zip code, while others obscure small numbers to protect student privacy.
Researchers combine this school entry data with the Centers for Disease Control and Prevention's National Immunization Survey (NIS-Child), which follows children from birth through twenty-four months. By comparing birth cohorts over time, analysts spot where parents delay shots, skip booster series entirely, or file nonmedical exemptions based on philosophical or religious beliefs.
The investigation revealed that the drop isn't uniform. While uptake for certain baseline shots like the hepatitis B birth dose remains relatively stable, multi-dose series—such as DTaP, MMR boosters, and varicella—show noticeable erosion, particularly among toddlers and kindergarteners.
What's Driving the Shift?
You can't pin the entire decline on a single factor. The data points to a complex mix of systemic hurdles and shifting public sentiment.
Disruptions from the pandemic era broke routine pediatric visit habits for millions of families. Once a child falls off the recommended immunization schedule, catching up takes deliberate effort. Many families simply missed appointments and didn't return to a regular pediatric care rhythm.
At the same time, institutional trust has frayed. Parents are bombarded with conflicting online messaging, social media algorithms that reward fear, and rising skepticism toward public health mandates. When local communities notice rising numbers of philosophical exemptions, permission structures shift. Skipping shots stops feeling like an outlier choice and starts looking like a normal option among peer groups.
Socioeconomic Disparities in the Data
Another critical layer uncovered by detailed tracking is the widening equity gap. Declines aren't happening equally across every demographic.
Data broken down by race and ethnicity shows that lower-income families, Black, Hispanic, and American Indian or Alaska Native children often face steeper barriers to completing multi-dose vaccine series. These gaps relate directly to healthcare access, paid time off for clinic visits, and the availability of pediatric providers in underserved neighborhoods.
When public health infrastructure weakens, vulnerable populations bear the brunt of the risk. Disadvantaged communities often lack the resources to manage outbreaks when vaccine-preventable diseases begin circulating through under-immunized schools.
Where Public Health Goes From Here
Reversing this trend requires moving past political noise and addressing the mechanics of healthcare delivery. Pediatricians and local health departments need resources to conduct proactive outreach, helping families get back on schedule before kids reach school age.
Data transparency remains our best diagnostic tool. Without rigorous tracking by journalists and researchers, communities wouldn't know where their immunity safety nets are fraying until an outbreak forces the issue.
Check your state's public health dashboard for local school immunization rates if you want to know what's happening in your own backyard. Talk directly to your pediatrician about catch-up schedules if your family missed routine visits.
The video above outlines the broader public health context surrounding sliding immunization rates and community immunity thresholds.