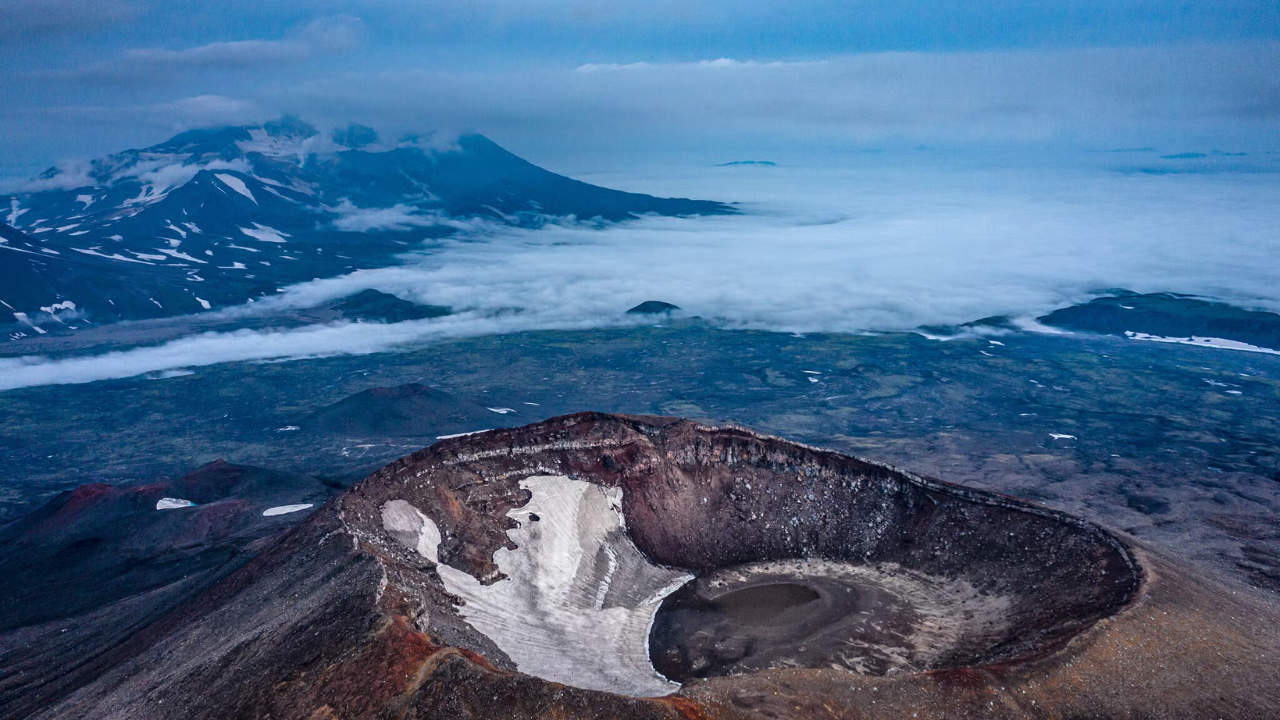
Tectonic faults don't just break randomly. They store stress for decades, bending like compressed springs until friction fails entirely. When a massive magnitude-8.8 earthquake ruptured the fault offshore from Russia’s Kamchatka Peninsula, it triggered destructive tsunami waves across the Pacific. But the most striking part of the event isn't the disaster itself. It's the fact that researchers found warning signs sitting in ground-motion measurements collected years before the ground ever shook.
By re-evaluating older satellite positioning records, scientists mapped a major locked zone that aligned precisely with the eventual rupture. This discovery rewrites how seismologists look at seismic hazards along major subduction zones. For a different view, see: this related article.
The Tectonic Setting Beneath Kamchatka
Kamchatka sits in a brutal tectonic meat grinder. In this region of the northwest Pacific, the massive Pacific Plate dives beneath the Okhotsk Microplate. This convergence happens at a rate of roughly 80 millimetres a year, translating to a little over three inches annually.
That sloping contact surface is known as a megathrust. It's an active engine capable of generating colossal seismic events. It produced a staggering magnitude-9.0 earthquake in 1952, followed roughly 73 years later by the magnitude-8.8 event. Foreshocks preceded the 2025 rupture, including a magnitude-7.1 event nearly a year prior and a magnitude-7.4 tremor just days before the main shock. Similar reporting on the subject has been published by Engadget.
How Faults Lock and Store Strain
Plates don't slide past each other smoothly. Portions of a subduction fault get locked tight by friction. The tectonic plates stick together while the surrounding rock slowly bends, storing massive amounts of elastic strain. This interseismic period can last for centuries. Other sections of the fault creep along silently without generating large earthquakes.
Researchers map these zones using ground-based satellite positioning receivers, space radar, and seafloor movement estimates. They feed these observations into computer models that simulate fault behavior. Comparing those models against real-world earthquakes reveals how subduction zones segment themselves and accumulate stress over time.
Unlocking the Past with Older GPS Records
Researchers Axel Periollat and Gareth Funning didn't start with a preconceived map of hazard zones. Instead, they analyzed horizontal ground-velocity measurements compiled in 2005 from satellite positioning stations on the peninsula. These stations had run continuously for more than four years alongside survey data collected annually between 2001 and 2003.
Using a computer model of the fault surface based on the Slab2.0 interface, an algorithm determined which fault elements remained locked. Starting from roughly two percent of locked elements at random, the team ran one million independent simulations of ten thousand steps each. This statistical approach produced a clear probability of locking for every part of the fault.
What the Data Reveals About Stored Energy
The primary locked region identified by the model consisted of 618 fault elements. In typical simulation runs, about 68 percent of those elements were locked, dropping off at depths near 68 kilometres where warmer temperatures allow the fault to slide freely.
When you factor in plate motion of 80 millimetres a year over the 73-year span since 1952, each locked element built up about 5.8 metres of slip deficit. Converting that stored strain into earthquake magnitude yields numbers between 8.85 and 8.99, which matches the 8.84 magnitude of the 2025 event. You don't even need the fault to be fully locked to recover roughly 90 percent of the energy released during the quake.
Why Ruptures Start at Specific Patches
Using hierarchical clustering, the study grouped fault elements that behaved similarly across the simulations. The algorithm split the zone into five sub-areas. The two most strongly locked patches sit close to where both the 1952 and 2025 earthquakes began. This indicates these specific structural asperities act as trigger points across multiple seismic cycles.
Large foreshocks clustered near the edges of this locked zone. Stress accumulates fastest at these boundaries, making them prime locations for initial failures before the main plate interface lets go.
The Tsunami Puzzle and Shallow Slip
Slip distance determines tsunami severity. The 1952 and 2025 earthquakes broke the same deep section of the fault, sharing a similar along-strike stretch of high slip. Yet the 1952 tsunami produced devastating wave heights of 15 to 18 metres in southern Kamchatka and the northern Kuril Islands, while the 2025 event reached only about two metres on Hawaiian coasts.
The discrepancy comes down to shallow slip near the oceanic trench. Tsunami models show the 1952 event featured massive shallow slip, whereas the 2025 rupture concentrated deeper with limited movement near the surface.
Furthermore, local slip in 2025 occasionally exceeded 20 to 30 metres, which is far greater than the 5.8 metres of slip that could have accumulated since 1952 at current convergence rates. This implies either that strain remained unreleased from the 1952 event or that post-seismic adjustment processes reloaded the fault much faster than standard models assume. Extending the timeline back to a great 1737 earthquake provides an even larger stored deficit equivalent to magnitude 9.1 or 9.3, proving that most tectonic energy discharges almost exclusively during giant megathrust events.
Limitations and the Need for Offshore Data
Science thrives on self-correction. Some high-probability patches north of 53 degrees latitude turned out to be artifacts that vanished when data from a single nearby station was removed. Deep clusters at 80 kilometres depth represent modeling edge effects rather than actual mechanical locking.
Offshore and shallow segments of the fault remain poorly resolved. Ground motion measurements on land can only tell you so much about what happens miles out to sea. Seafloor geodesy—tracking ground motion directly on the ocean bottom—remains the essential next step to map rupture zones and assess tsunami risks with real precision.